
Enhanced AI models using synthetic data

Escrito por:
Jordi Vila27 de Julio de 2023
Complementary training of AI models with synthetic data enhances the model's ability to infer less common scenes.
AI-based Computer Vision (CV) allows computers to see and understand pictures and videos. CV is becoming an important tool in the sports sector for both professionals and aficionados.
In this blog post, we will discuss how AI-based CV can automatically analyze a game, where obtaining accurate measurements of distances and angles on the football field is crucial. This objective is achieved by solving the problem of football field registration, which involves estimating the homography matrix transformation.
It maps 2D image coordinates to a 3D football field template for each video frame, providing real-world information from football images and can shift from one view to another view of the same scene. This allows us to precisely calculate the positions of various elements on the field, enabling us to analyze player movements and assess tactics.
The approach of football field registration and homography estimation is not limited to football alone, as it can be extended and applied to any other sport.
The real homography matrix could be computed if all camera parameter values used for recording the game were known. However, a football match, or any sports match for that matter, is recorded by a wide variety of cameras with different characteristics and positions, which still need to be discovered and make it challenging to obtain the homography matrix. Hence, several classical computer vision approaches first appeared to tackle this problem.
However, due to the manual labeling methods required to compute the homography matrix and the time-consuming nature of the process, we decided to explore a deep learning approach, which has the advantage of automatically learning features and patterns from data, potentially eliminating the need for manual labeling and offering a more efficient and automated solution to compute the homography for key points in an image.
Moreover, due to the limited availability of public football datasets annotated with their corresponding homography matrix, it was necessary to create our datasets and images. We used synthetic data to address this challenge and improve the model's performance. By generating synthetic data, we were able to augment the number of images available for training the deep learning model. This approach allowed us to expand the dataset and evaluate how including synthetic data impacts the model's performance.
Synthetic data Creation with Blender
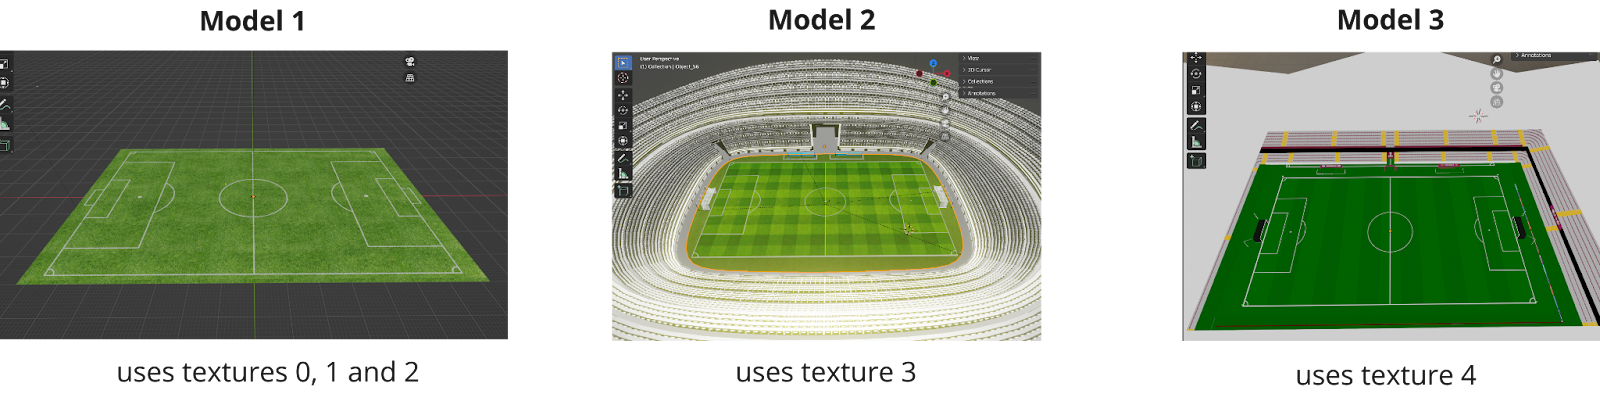
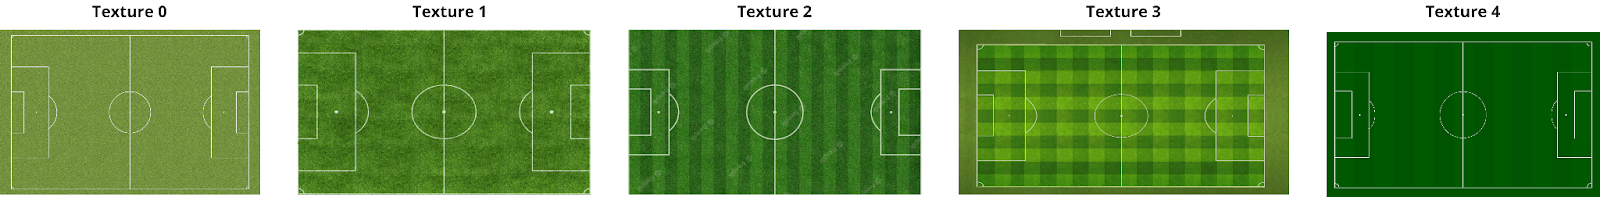
Synthetic Football images were obtained using Blender, a robust open-source 3D creation software widely used for modeling, animation, and rendering. Several football field models and textures have been used to extract various scenes from several internet sources.
|
|
Figure 1. Football Field Blender Models |
|
|
Figure 2. Football field textures |
We designed two camera position trajectories throughout the football field 3D model to obtain different perspectives of the football scene.
|
|
Figure 3. Camera trajectories definition through a football field Blender model. |
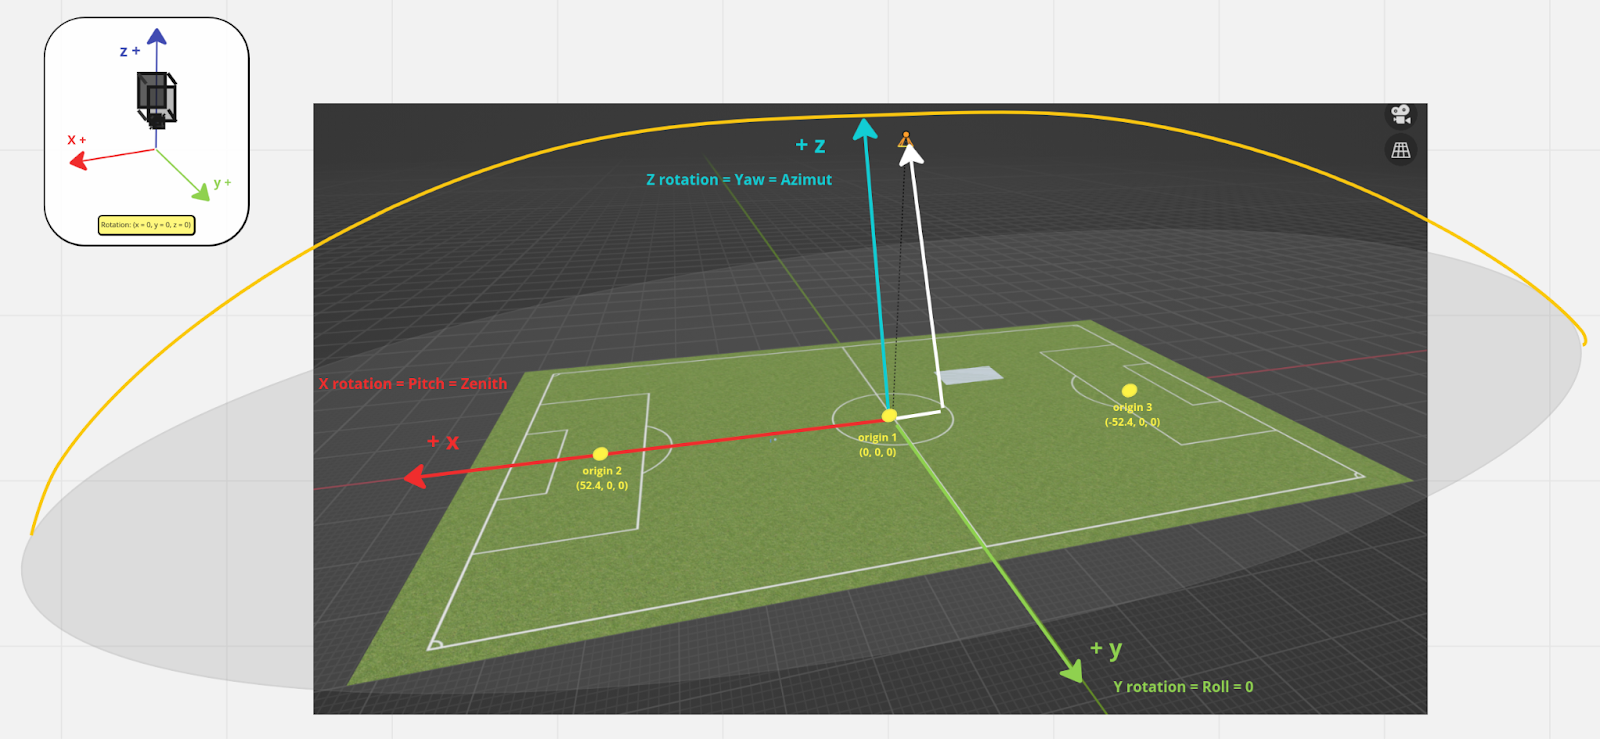
Blender uses cartesian coordinates, but, to create different scene perspectives, we use the azimuth and zenith angles, and, to parametrize them, it is easier to use spherical coordinates.
For each origin center, we repeat the following processes for different radius and azimuth values:
-
Change the azimuth angle to rotate the camera around the origin center with a fixed radius and zenith value. (we repeated this process for different radius and zenith values)
-
Change the zenith value with fixed radius and azimuth angle to move the camera from one side of the sphere to the other one and the same orbit going over the origin center.
In total, 462 different perspectives have been defined, and considering that we set other quality and contrast conditions for each perspective, as can be seen in Figure 4, it allowed us to have a significantly large dataset (6468 labeled images) of synthetic data.
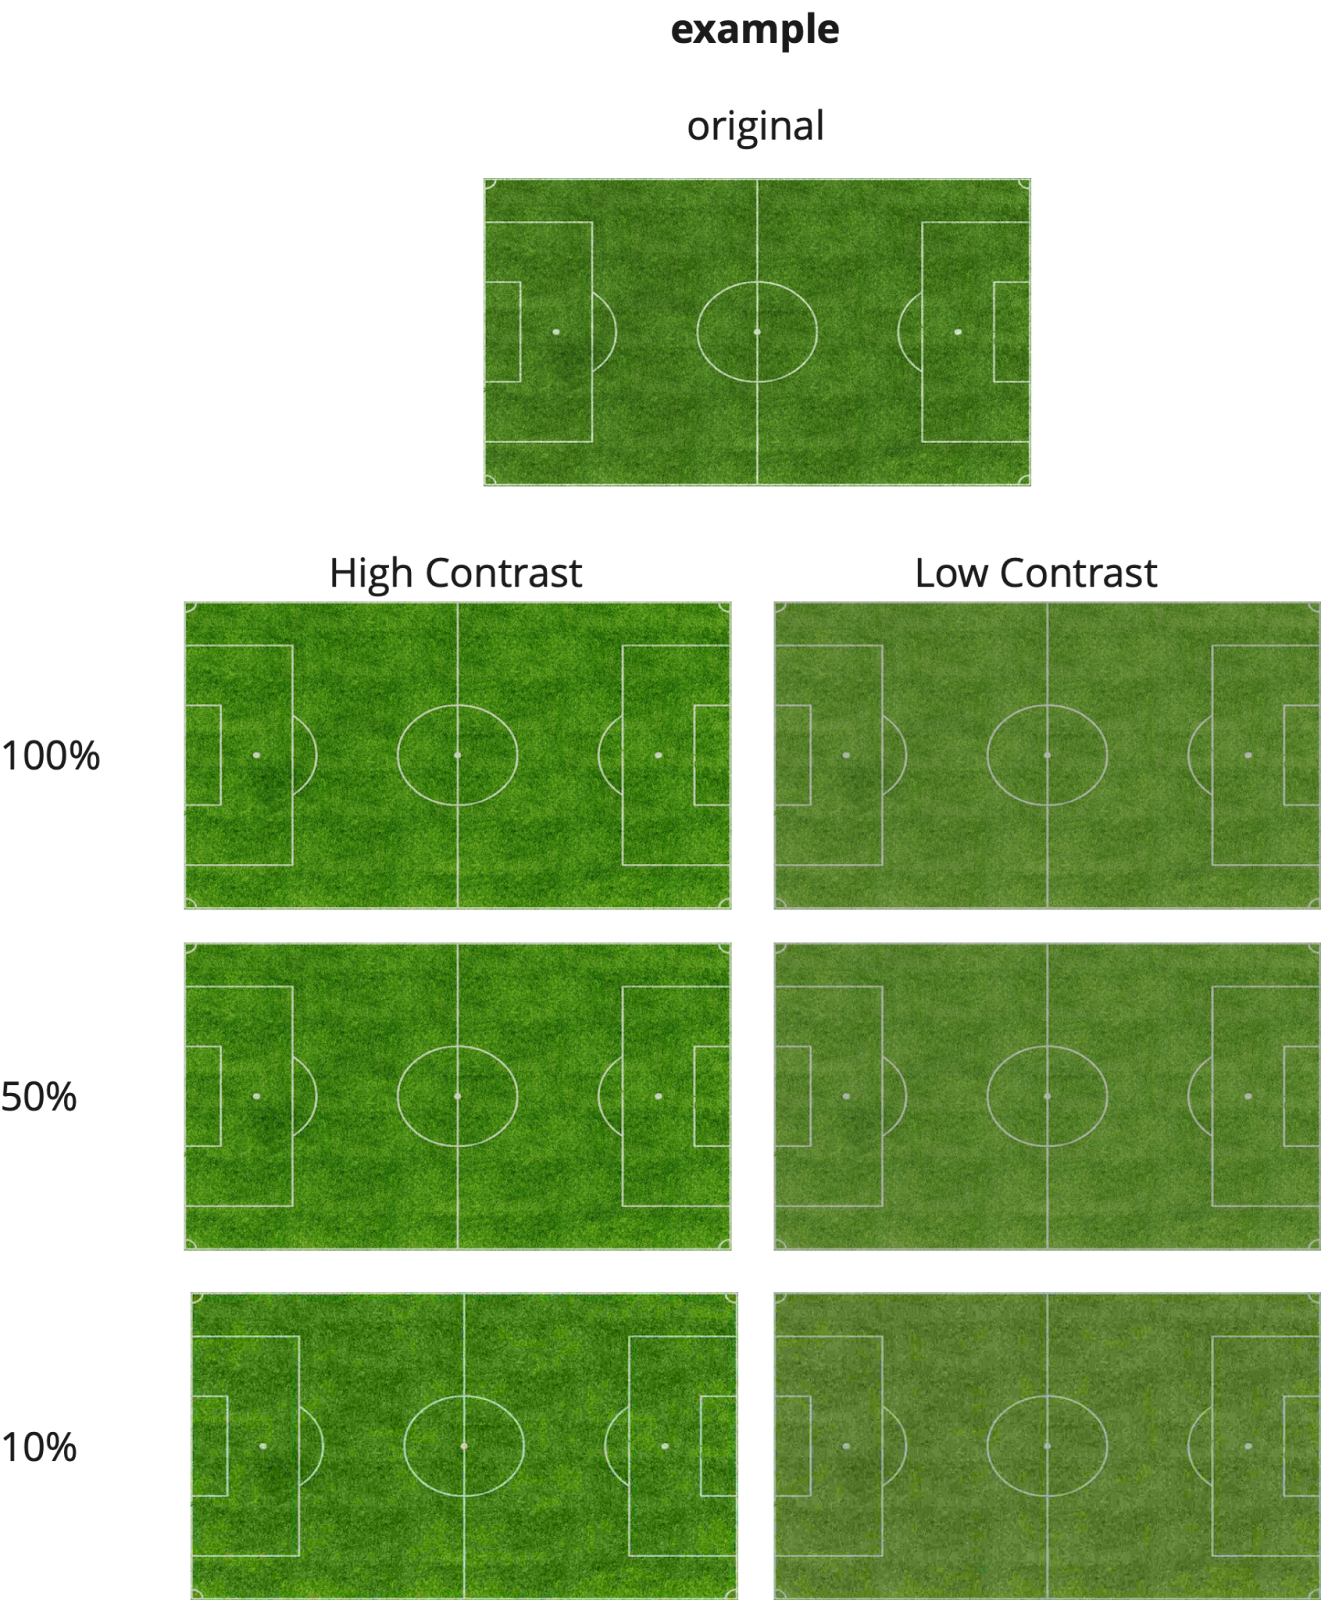
Figure 4. Example of the quality and contrast conditions applied to a synthetic image.
To label these synthetic images, it has also been necessary to compute the homography matrix, which is the ground truth, between a football scene and the bird's view of the synthetic football field. This computation requires the knowledge of the camera poses of both cameras. Specifically, the extrinsic and intrinsic matrices from each camera pose that are provided by Blender.
Moreover, the two input images must be captured using the same camera, meaning they share the same camera intrinsic and image dimensions (in our case, 1280x720).
|
|
|
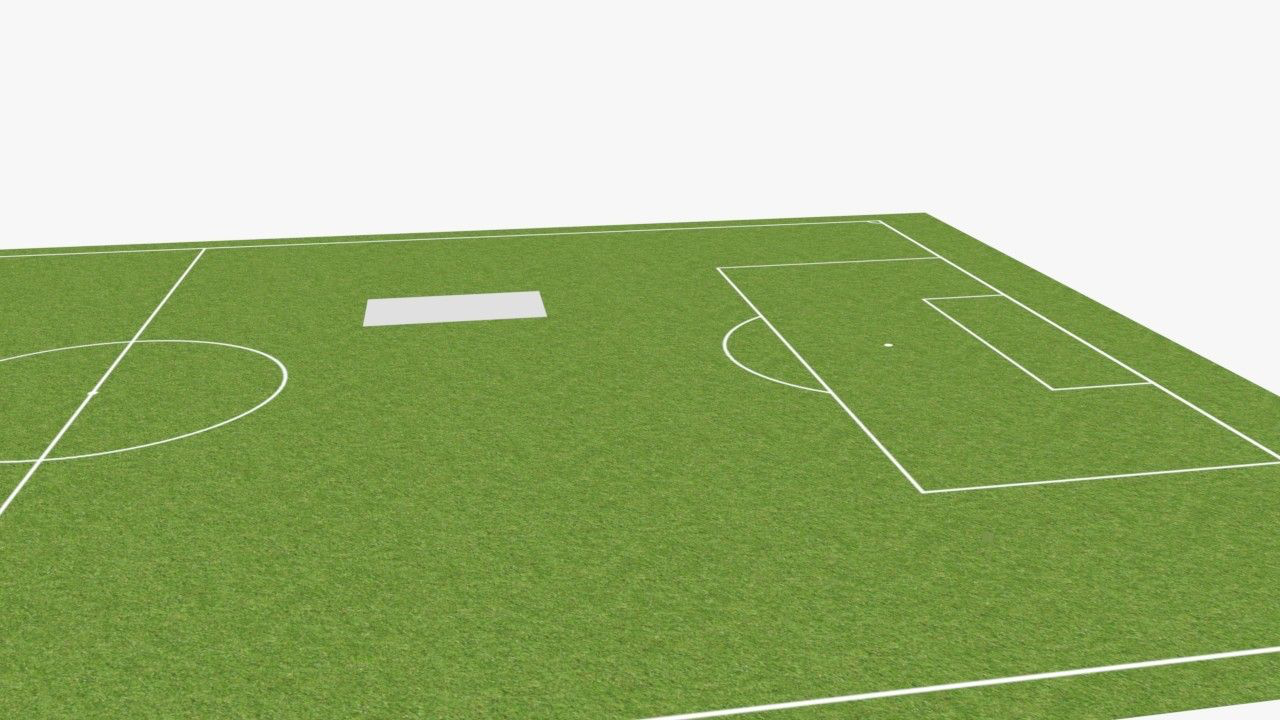
Figure 5. Football scene captured from any position |
Figure 6. The bird's view of the football field |

Once Blender provides all camera parameters, the formula calculation consists of three steps.
Step 1: Obtain the input parameters (Relative Rotation Matrix (2R1), Relative Translation vector (2t1), normal vector (1nT), and distance (1d) of the formula below:
Equation 1. Homography Matrix formula given the camera parameters (intrinsic and extrinsic).
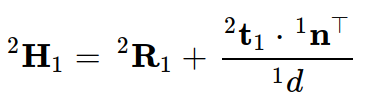
The formula is obtained from the OpenCV documentation:
Step 2: Multiply the homography matrix obtained in Step 1 with the intrinsic matrix (K) and its inverse, as shown in the following formula.
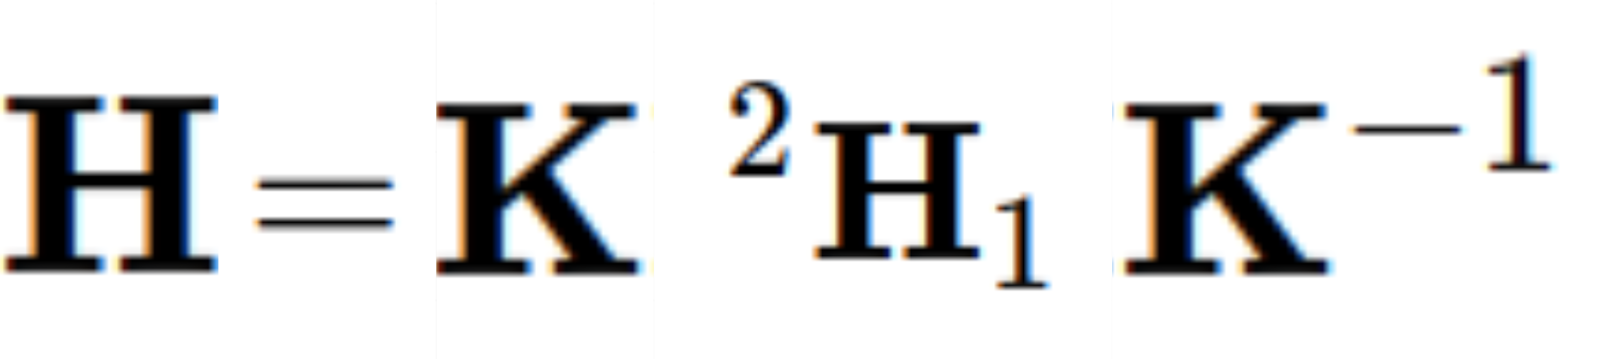
Equation 2. Homography Matrix formula to relate two different image scenes taken with the same camera.
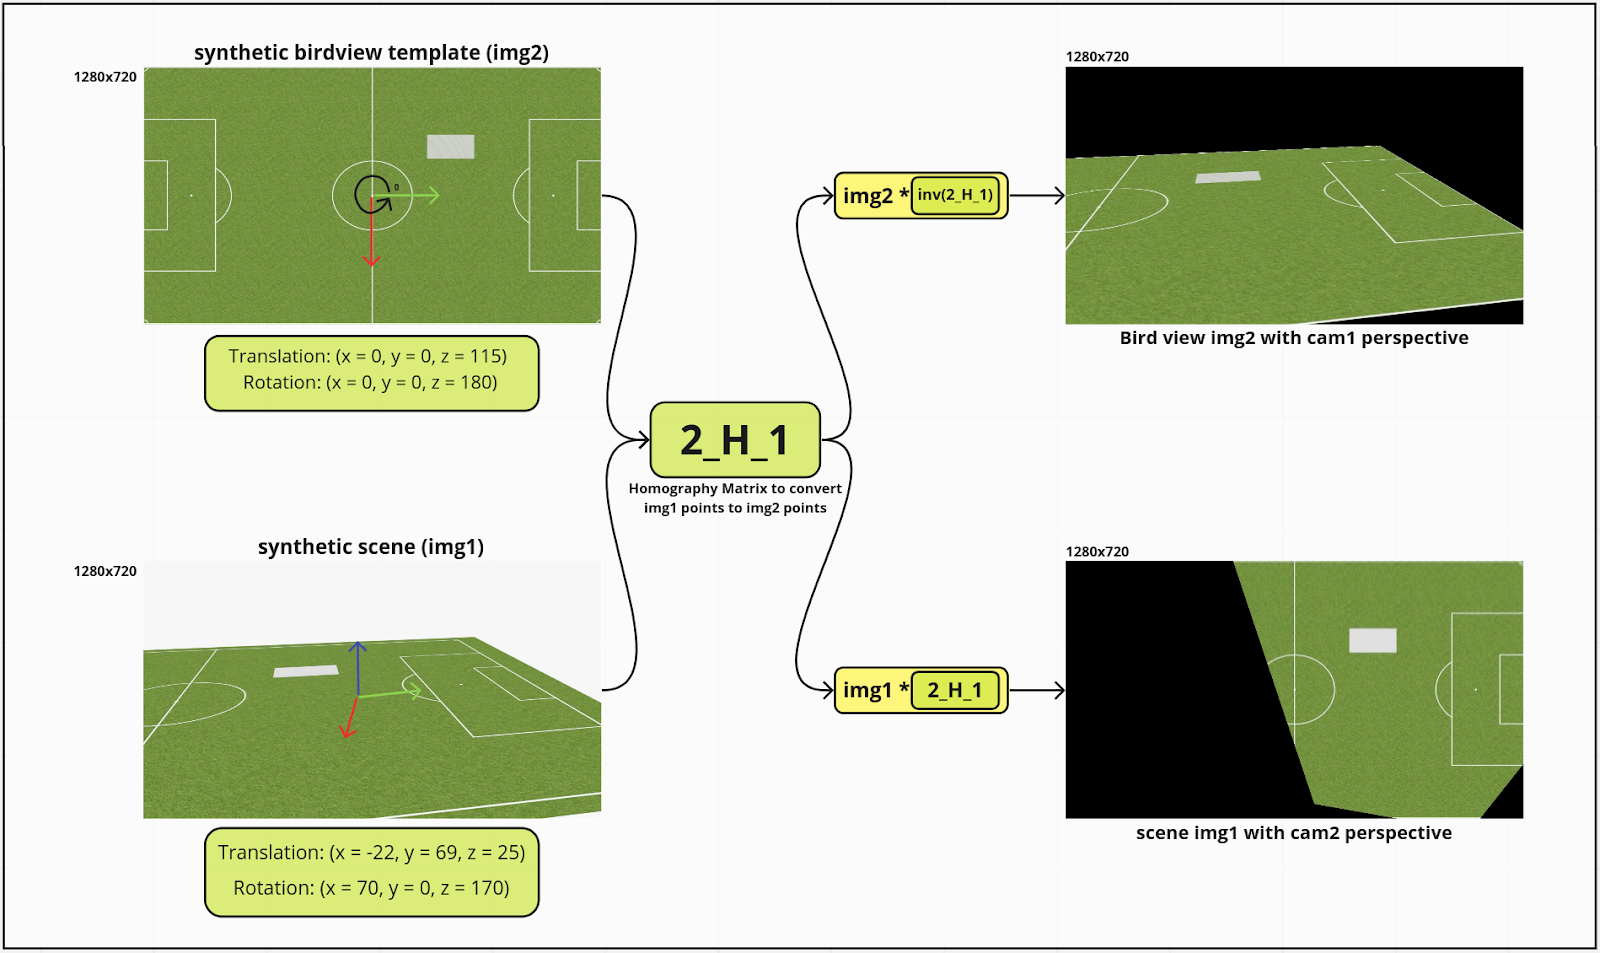
|
|
Figure 7. Visual explanation of the Homography matrix obtention process between a random football field scene (img1) and the football field template in bird view (img2). Corresponds to Steps 1 & 2. |
Step 3: The homography matrix between the football field bird view image and a random scene with the same camera (same Intrinsic matrix, image width, and height) is already obtained from the previous steps.
However, the labeled homography for our model is computed between a random scene image of 1280x720 with a bird view template of 115x74, assigning the football field's actual dimensions as 115 meters long and 74 meters wide. To have the correct ground truth matrix for our model, it needs to be scaled down from a 1280x720 image size to a 115x74 image size (Figure 8).
Figure 8. Visual explanation of down-scaling the homography matrix. |
Figure 9. Visual explanation of up-scaling the homography matrix. |


Synthetic Dataset Experiments & Conclusions
The chosen architecture for this project is the encoder-decoder or autoencoder, as it is a good choice for predicting key points in an image because it is specifically designed to learn efficient representations and reconstruct input data, making it suitable for capturing intricate patterns and spatial relationships in images.
To determine the best model configuration for our specific task, we carried out an extensive series of experiments. These experiments involved utilizing various customized datasets, which consisted of synthetic data, real data, and a combination of both, using hyperparameter optimization, specifically concentrating on fine-tuning the learning rate. This process allowed us to identify the optimal settings for the model's performance and accuracy.
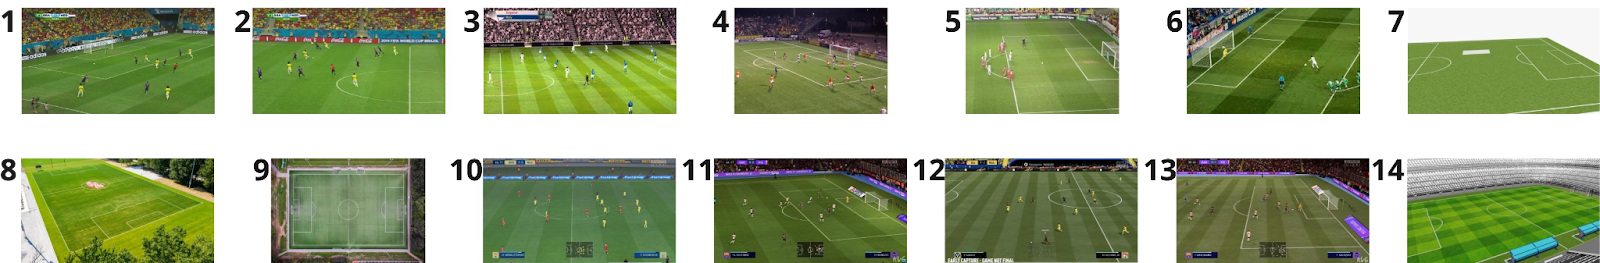
To evaluate the different models it has been used a dataset consisting of 14 images (Figure 10) which contain a diversity of football scenes. It aimed to determine the models' ability to handle synthetic and real images, as well as more challenging perspectives and textures. It is important to note that this evaluation was conducted exclusively by visually inspecting the resulting warped images without utilizing quantitative metrics.
|
|
Figure 10. Dataset of 14 images: used to evaluate the models |
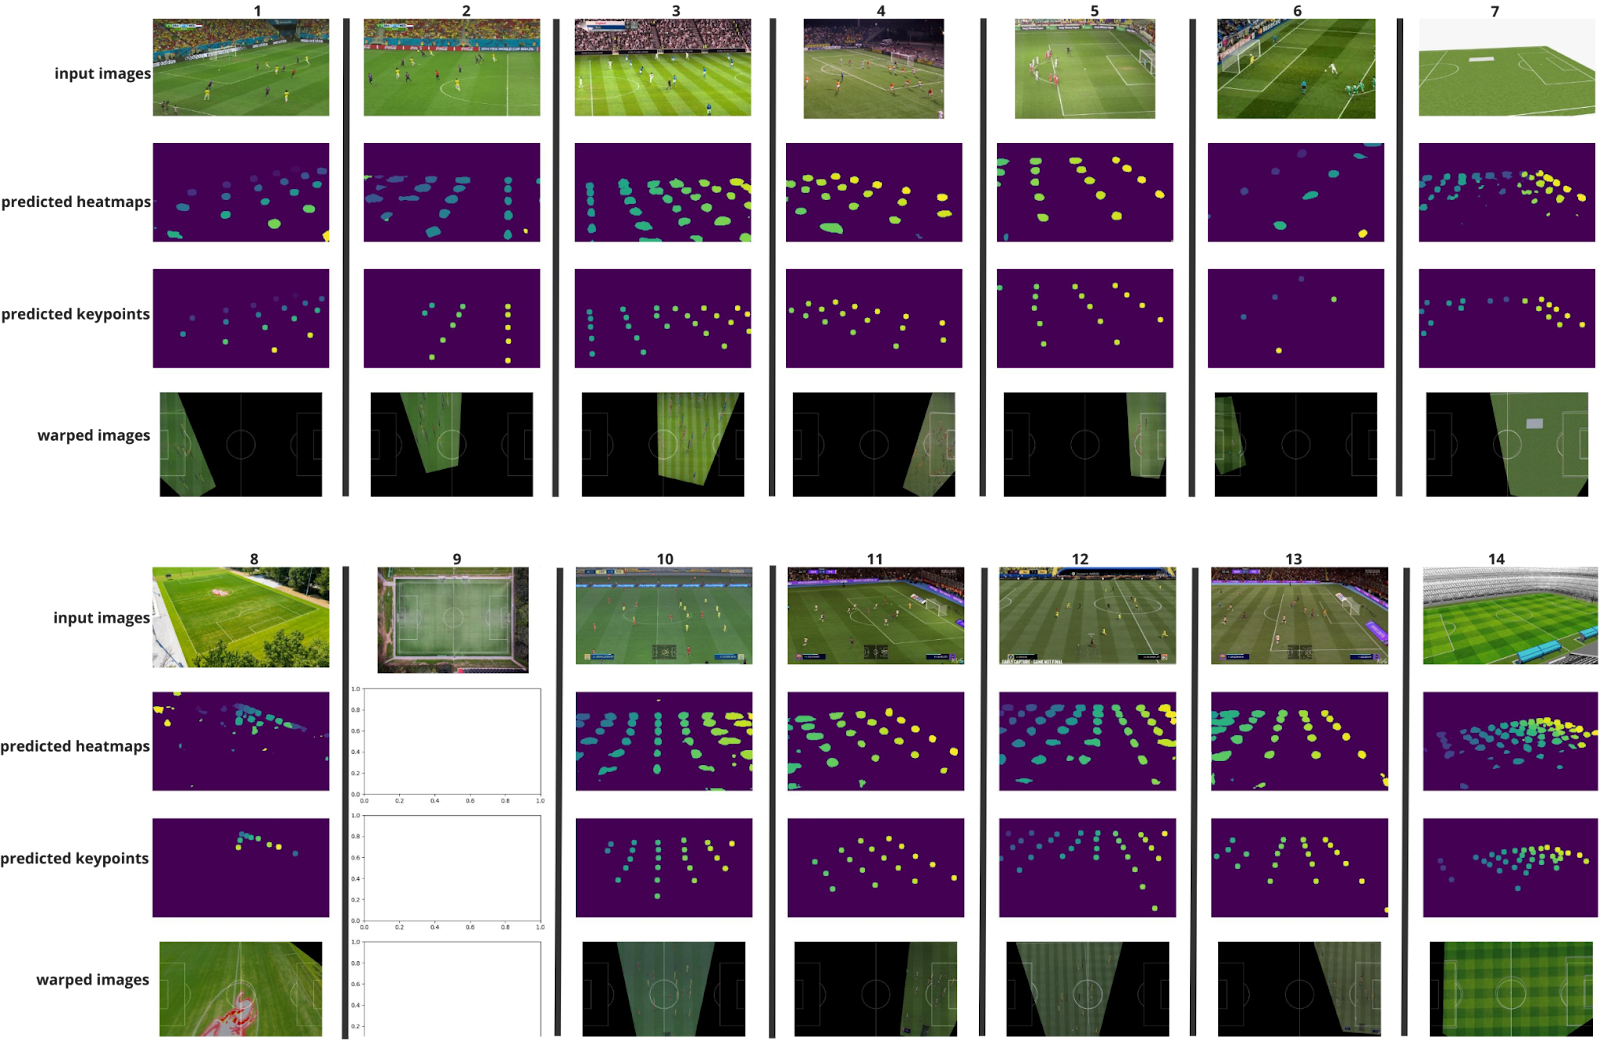
The model with the best performance when predicting the previous 14 images was the one trained with real and synthetic images with the following visual results.
|
|
Figure 11. The visual result of the best model predicting the evaluation dataset with mixed images |
Despite obtaining visual results from the previous visual evaluation over several experiments, it remained to be seen whether the error in the warped images was significant in terms of real-world distances.
To address this, a final evaluation process was conducted, focusing on calculating the average key point error in meters using a small dataset of 14 real football images (Figure 12), defining image four as the worst-case scenario.
|
|
Figure 12. The visual result of the best model predicting the evaluation dataset with mixed images |

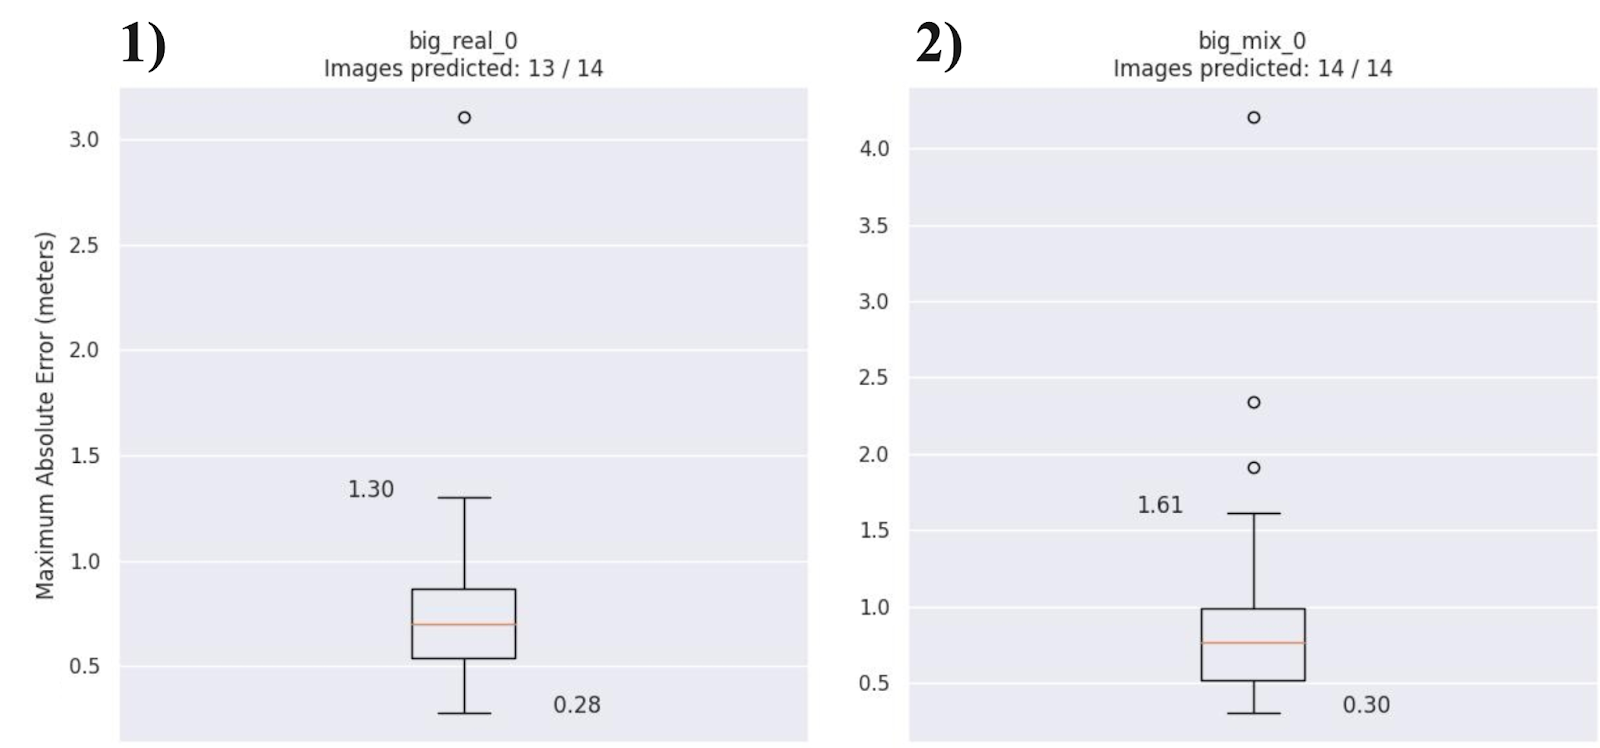
The results are shown as boxplot graphics illustrating the distribution of maximum absolute errors for the top two models. The first model was trained exclusively with authentic football images, while the second model utilized a combination of real and synthetic data. Surprisingly, both models demonstrated similar results.
Upon analyzing accuracy, it was observed that the model trained solely with accurate data outperformed the other model by a small margin. Most errors for this model were concentrated between 1.30 meters and 0.28 meters, as depicted in Graphic 1 of Figure 13. Conversely, the second model exhibited most of its errors between 1.61 and 0.30 meters, with the additional presence of three outlier values, as indicated in Graphic 2 of Figure 13.
|
|
Figure 13. The visual result of the best model predicting the evaluation dataset with mixed images |
However, when considering the overall number of images the models could predict, the model trained with a combination of synthetic and real images proved more effective. This model successfully identified key points for all images, even in the worst-case scenarios. Furthermore, when dealing with less common perspectives, the model trained with mixed data exhibited superior performance.
Two examples of two images predicted with both models demonstrate that the model trained with mixed data (big_mix_0) is better in less common scenarios than the model using only accurate data.
|
Worst-case scenario (image 4) |
|||
|
|
|||
|
Model results when trained with synthetic and real data |
Model results when trained with only real data |
||
|
Predicted heatmaps |
|||
|
|
|
||
|
Predicted key points |
|||


|
|
|
||
|
Warped images |
|||
 |
|||
| To compute the homography matrix is required a minimum of four key points, as can be seen from the image above, there are only three key points predicted by the model, which means that it is not possible to estimate the homography and as a consequence, no warped image will be displayed. |
|||

In conclusion, our findings suggest that including synthetic data enhances the model's ability to infer less common scenes and provides better performance across a wide variety of prints.
Don't miss out on the opportunity to take your AI models to the next level. Contact us now!

